A lab microscope turned into an AI slide scanner
We added X, Y and Z axes to a lab microscope so it captures a whole slide tile by tile and stitches it into one image. Our AI software then flags suspected cancer cells, using the settings the doctor or lab technician chooses.
From one small view to the whole slide
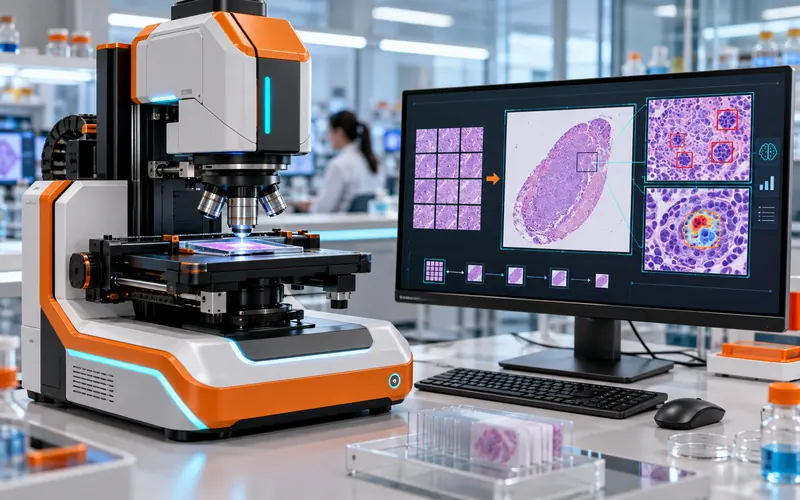
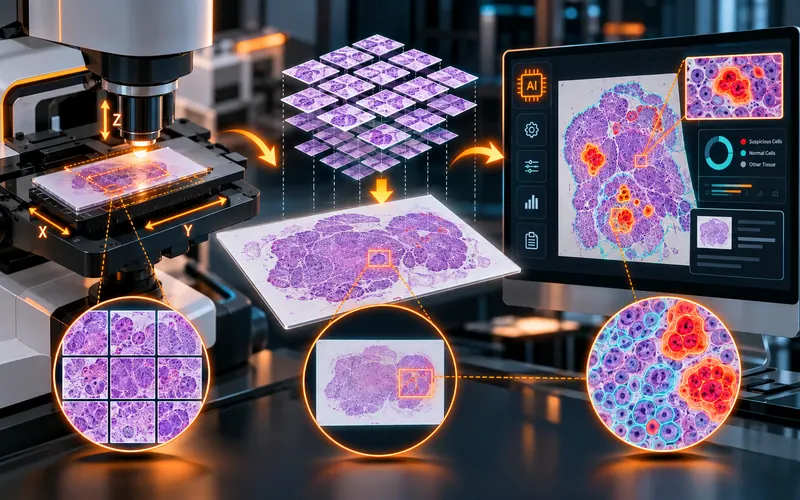
A microscope sees a small circle of the slide at a time. Our upgrade moves the slide under the lens, captures all of it, and gives the doctor one image with the findings marked.
- axes added: X, Y and Z
- 3
- image of the entire slide
- 1
- 01
The mechanism
Motion added to the microscope, so the slide moves and focuses under control.
- X and Y axes for the slide
- Z axis for focus and zoom
- Precise, repeatable steps
- Built onto the existing microscope
- 02
Whole-slide imaging
The slide is captured tile by tile and stitched into one image you can pan and zoom.
- Thousands of tiles per slide
- Auto focus
- Stitched into one image
- Overview with pan and zoom
- 03
AI analysis
The software marks suspected cancer cells, working to the doctor's or technician's settings.
- Suspected cancer cells and regions
- A confidence and heatmap for each slide
- Sensitivity, threshold and cell types set by your lab
- Measurements and reports
The challenge
A microscope shows only a small part of a slide at a time. Checking a whole tissue sample means moving the slide by hand, refocusing again and again and looking through thousands of fields one by one: slow, tiring work in which a small group of abnormal cells is easy to miss.
What we built
We added motion to the microscope: X and Y axes that move the slide in precise steps, and a Z axis for focus and zoom. The system captures the slide as thousands of small tiles and stitches them into one high-resolution image of the entire slide. Our software then analyses the cells with AI and highlights suspected cancer cells and regions, according to the sensitivity, threshold and cell types the doctor or lab technician sets. Every finding is shown to them for review; the final decision stays with the doctor.
Engineering highlights
- X and Y axes added to a standard lab microscope, moving the slide in precise, repeatable steps
- A Z axis for focus and zoom, with auto focus before the scan
- Thousands of tiles captured per slide and stitched into one whole-slide image
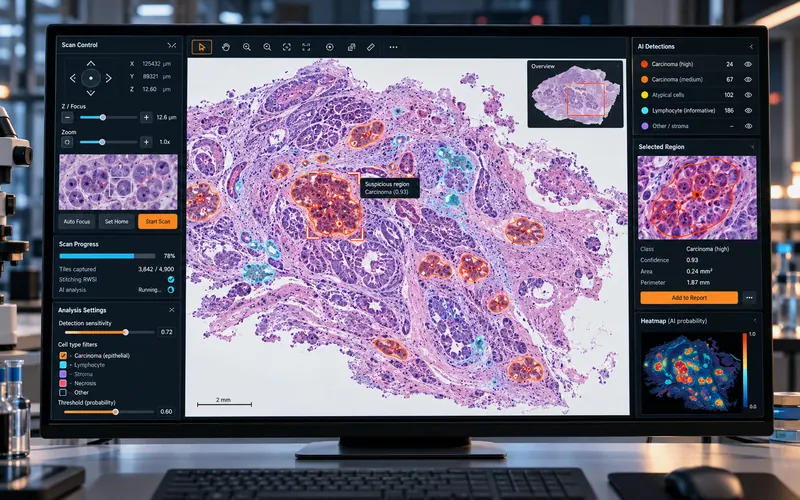
- AI that outlines suspected cancer cells and regions, with a confidence for each and a heatmap of the slide
- Sensitivity, probability threshold and cell types set by the doctor or lab technician
- Each finding measured (area and perimeter) and added to the report in one click
Scan, stitch, analyse, review
- 01
Load and focus
Place the slide and set the home position. The Z axis finds the focus.
- Home position
- Auto focus
- 02
Scan tile by tile
The X and Y axes move the slide in small steps while the camera captures each field.
- Thousands of tiles
- 03
Stitch
The tiles are joined into one high-resolution image of the entire slide.
- Whole-slide image
- 04
Analyse and review
The AI marks suspected cancer cells using your settings. The doctor reviews each finding and adds it to the report.
- Findings
- Heatmap
- Report
AI that works to your lab's settings
The software doesn't decide on its own. Doctors and lab technicians choose what it looks for and how sure it must be, and every finding comes back to them for review.
Cell detection
Finds and outlines suspected cancer cells and regions across the whole slide.
Your sensitivity and threshold
Set how sensitive the detection is, and the probability a finding must reach before it is shown.
Cell types to look for
Choose which cell types to flag, such as carcinoma, lymphocytes, stroma or necrosis.
A confidence for every finding
Each flagged region shows its class and how confident the AI is, so it can be checked quickly.
Heatmap of the slide
See at a glance where on the slide the suspicious areas are.
Measured and reported
The area and perimeter of each region, added to the report with one click.
More work
All work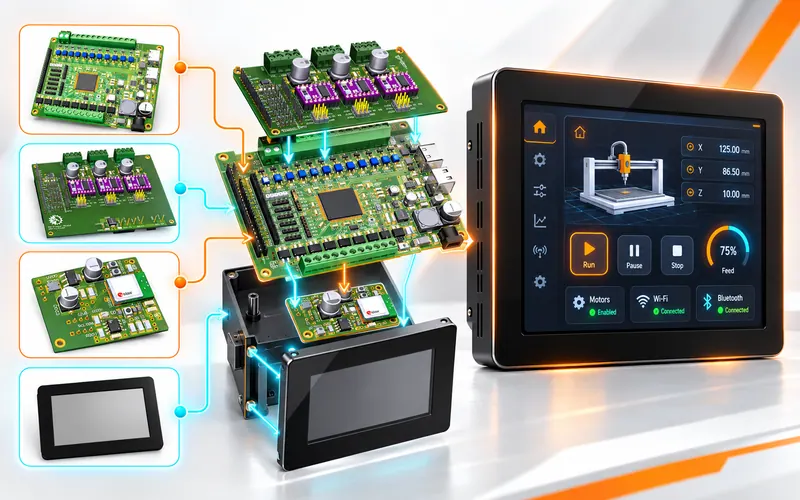 AI inside
An industrial controller you program by describing it
Our own STM32-based controller and the Shree-Mazu Workbench, which generates and flashes its firmware from a canvas or a plain-English request.
Read the case study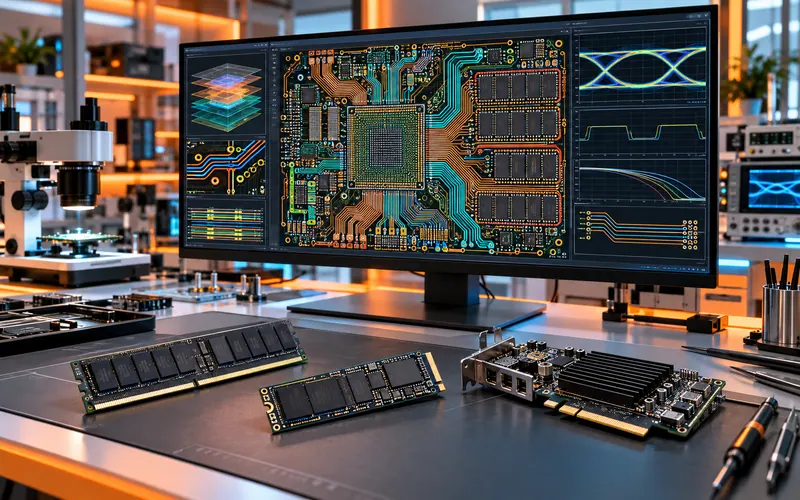
Complex high-speed boards, from our own RAM to AI cards
Our own RAM, SATA III, NVMe M.2 and PCIe SSDs, an AI card and a high-speed single-board computer, on PCBs from 4 to 12 layers, with signal-integrity, eye-diagram and crosstalk reports.
Read the case study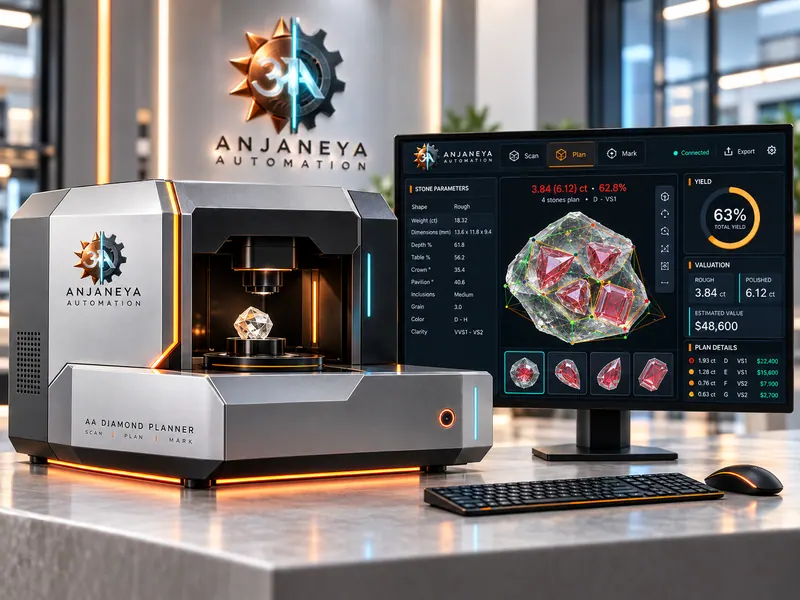
The Diamond Planner machine, designed end to end
A machine that scans a rough diamond in 3D and plans the most valuable stones inside it, using our own gravity-based optimization. We designed all of it: the mechanics, the 6-axis controller board and the software.
Read the case studyReady to make your machine smarter?
Tell us about the machine you run or the product you imagine. We reply within 24 hours on working days. We sign an NDA before you share details.